


![]()
General Overview and Facts and Figures
Australia has a rapidly growing eCommerce market, with online sales accounting for a larger share of overall retail sales each year, and with an expected year-on-year increase of 16.8% in 2023.
As a result, even though local brands have been presented with many opportunities and chances for growth, they also have faced various obstacles as local eCommerce grew strongly. This brought about an abrupt and lasting change in consumer behavior, resulting in a shift in how shoppers buy and pay for their purchases. They are more accustomed to buying products online from a wider range of retailers and categories, and now, more than ever before, retailers must find ways to streamline the online shopping experience in order to remain competitive in the market.
In this report, which is based on data from ACI and produced in association with The Paypers, we will analyze the local payments and eCommerce space by having a closer look at the main trends and developments in how people shop and pay online in Australia.
The eBook is intended as a snapshot of the insights that matter most when measuring the size and type of opportunities in the eCommerce market in Australia. Read on to discover the trends that are here to stay, the factors driving eCommerce, which are some of the most popular merchants in Australia, and the main insights into market readiness for vCommerce and crypto payments.
2 / 23
![]()
![]()
![]()
25.77 million (2021)
92% (2022)
73.08% (2018)
| 0-14 | 15-64 | 65 and above | |
| 2015 | 18.9% | 66.5% | 14.7% |
| 2025 | 18.2% | 64.6% | 17.3% |
Banked Population
(% aged 15+)
100%
104.9 (2022)
Smartphone Penetration by Age Group
| GenZ & Millennials | 18-24 | 25-29 | 30-39 | 40-49 | 50-62 | 65-74 | 75+ |
| 99% | 99% | 98% | 98% | 95% | 90% | 84% |
*Global Data, 2022. Australia Macroeconomic Report, 2022 [https://bit.ly/435Iqix] please note you require a subscription to access this data

*expected
3 / 23
![]()
![]()
![]()
Factors Accelerating
eCommerce Growth
One of the accelerating factors behind eCommerce growth in recent years is represented by the lockdowns that were in place during the COVID-19 pandemic, when consumers turned to online shopping in record numbers – according to Australia Post, over four in five Australian households (almost 9 million) made an online purchase at some point in 2020. This resulted in online purchases that year growing by 57% compared to the previous year, and Australian shoppers spending $50.46 billion online.
As expected, this translated also into growing popularity when it comes to online payment options, with consumers opting more often for contactless payment methods and mobile payment apps and eWallets. Australian businesses have been quick to adapt to this trend, with many investing in eCommerce platforms and online payment solutions to meet the changing needs of their customers.
Other factors driving growth in the Australian eCommerce market are simplicity and speed, security, and paying in installments.
4 / 23
![]()
![]()
![]()
Consumers’ Preferences in Terms of Online Shopping
Of all the product categories available online, the most popular ones in Australia include clothing, which is the most common category purchased online, followed by shoes, bags and accessories, consumer electronics, and cosmetics and body care. The products purchased online less often are toys and baby products, furniture and household goods, and sports and outdoor products.
When we take a closer look at the online stores and marketplaces that are popular in Australia, we see that many of them are local brands, such as Woolworths, Coles, Officeworks, or JB Hi-Fi. Woolworths, one of the biggest players in the Australian B2C eCommerce market, had a revenue of $3,874 million in 2021, followed by Coles with $2,211 million, and Officeworks with $1,004 million. Another important player in the Australian eCommerce market is the global brand Apple, which registered a revenue of $1,211 million in 2021. According to eCommerceDB, Woolworths, Coles, and Apple accounted for 30.2% of the top 100 online stores’ revenue in Australia that year.
According to eCommerceDB, Woolworths, Coles, and Apple accounted for 30.2% of the top 100 online stores’ revenue in Australia that year
5 / 23
![]()
![]()
![]()
The Cross-Border Opportunity
In 2021, 20% of Australians bought products from international sellers, with 40% of recent purchases being from China, as Australia Post reports. The proportion of products bought from the US has declined recently and now accounts for 21% of overseas purchases, followed by the UK with 14%. One of the main reasons behind this decline is represented by the international freight bottlenecks caused by the pandemic.
With the reopening of the Australian borders following the COVID-19 pandemic shutdown, however, both small and medium-sized enterprises as well as larger companies have recognized the expansion potential of this market. This trend goes hand in hand with the growth of eCommerce in Australia.
40%
of recent purchases
being from China,
as Australia Post
reports
6 / 23
![]()
![]()
![]()
Sector Trends –
Increase in Average Ticket Value
Whilst online growth has been strong across most channels, BOPIS/ Click & Collect experienced a 9% decrease in the volume of transactions. Despite this, the Average Ticket Value increased by 30% or $38. A higher ATV suggests that consumers are keen to pick up those hard-to-get items in person – and not risk a slow or lost delivery. There has also been a shift in late 2022 with consumers shopping earlier in the quarter, ahead of Christmas shopping in December, to take advantage of the heavy discounts seen around Black Friday. Because of this shift, in November 2022, retail turnover increased by 1.7%.
Not all sectors have experienced the same level of growth in 2022. The need to see the world again after two years behind closed borders or wanting to reunite with loved ones after a few tumultuous years has led to a particularly large increase in transactional volumes in the Travel sector, which experienced 141% growth. Telecommunication purchases also saw strong growth, reaching 79%, as consumers spent happily on connected technology during and after the pandemic.
*AusPayNet Annual Review 2022
7 / 23
![]()
![]()
![]()
Sector Trends –
Transaction Volumes Slightly Up
Overall, Australia experienced nearly the same volume of transactions (+1%) in H1 2022 compared to 2021. Domestic transactions saw a growth of nearly 3%, with the average purchase value increasing by nearly 100% – or by $143. Additionally, driven by mandates and compliances along with Australian consumers’ behavior, there was a 1% drop in fraud attempts.
Payment Methods
Credit and debit cards experienced an 8% increase in volume of transactions, with the average ticket value increasing by 59% – or by $117. With 3DS V2.x driving dynamic authentication, the approval rates for domestic transactions increased by 6%, and genuine transactions outpaced fraudulent ones. There was a 0.04% drop in fraud attempts, and ACI customers have been enjoying a 0.01% chargeback rate.
In 2022, eWallets
experienced a
135% – or $58
– increase in ATV, as
shoppers
concerned by fraud increased
their eWallet spending.
8 / 23
![]()
![]()
![]()
Payment Channels
Mobile transactions made up 15% of all eCommerce traffic, while desktop devices remain highly popular as the volume of transactions increased by 16%, mostly driven by domestic payments (22% increase). Merchants experienced a 1.3% decrease in fraud attempts, and the approval rates for merchants experienced no change in 2022 compared to H1 of 2021, remaining at >97%.
In 2022, the value of transactions increased by 48%, with the ATV increased by 227% – or $195. This was driven by higher confidence and increased security around mobile traffic, which resulted from mandates and security upgrades as well as fraud management services offered by technology providers. Mobile devices experienced a 0.02% increase in fraud attempts, with the overall transaction approval rate being always higher than >97%.
Delivery Channels
BOPIS/Click & Collect experienced a 9% decrease in volume of transactions, with the ATV increasing by 30% – or $38. This was potentially driven by shortages of stock, leading shoppers to discover a convenient option of securely purchasing online and enjoying the in-store experience while picking up their article. Overall, fraud attempts decreased by 0.2%, while domestic transactions for BOPIS experienced >98% approval rates. ACI customers enjoyed 0.001% in chargeback rates.
9 / 23
![]()
![]()
![]()
Travel and Telco – Big Gains in
Transaction Volume
Travel and Telco Sectors
The travel sector grew at a significant pace, with a 141% increase in volume of transactions. Shoppers’ ATV grew by 64% or $289, which could be seen as an after-effect of the pandemic – as travel demand surges, shoppers prefer spending more on experiences.
The travel sector experienced a 0.6% increase in fraud attempts, mostly arising from a 0.8% rise in fraud attempts for domestic transactions. Nevertheless, ACI customers experienced the lowest chargeback rates of 0.02%.
The telco sector purchases experienced a 79% increase in volume of transactions, driven by rising mobile subscriptions and internet users (from 89% in 2021 to 91% in 2022).
As genuine transactions outpace fraudulent ones, the telco sector experienced a 2.8% decrease in fraud attempts, driven by domestic transactions, which experienced a 4.9% decrease in fraud attempts. ACI customers experienced a boost of 5% in transaction approval rates.
10 / 23
![]()
![]()
![]()
Digital Downloads and Retail Sectors
The digital downloads sector experienced a 36% rise in value of transactions, with a 47% increase in the value of transactions arising from domestic ones. This is likely driven by the adoption of e-learning and online courses. The digital downloads sector also experienced a 2.4% increase in fraud attempts, as fraudsters try to utilize the opportunity of higher adoption rates.
The retail sector experienced slower growth, of 2% in volume of transactions, coming from domestic transactions – with shoppers’ ATV increasing by 1% or $1, due to economic uncertainty and customers diverting their spending into other sectors. The retail sector also experienced a 3.2% decrease in fraud attempts, as fraudsters potentially shifted their focus towards more lucrative sectors. ACI customers enjoyed the lowest in class chargeback rates (0.03%).
11 / 23
![]()
![]()
![]()
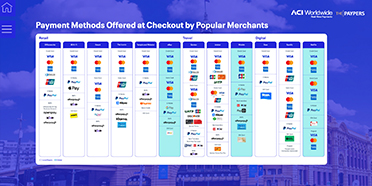
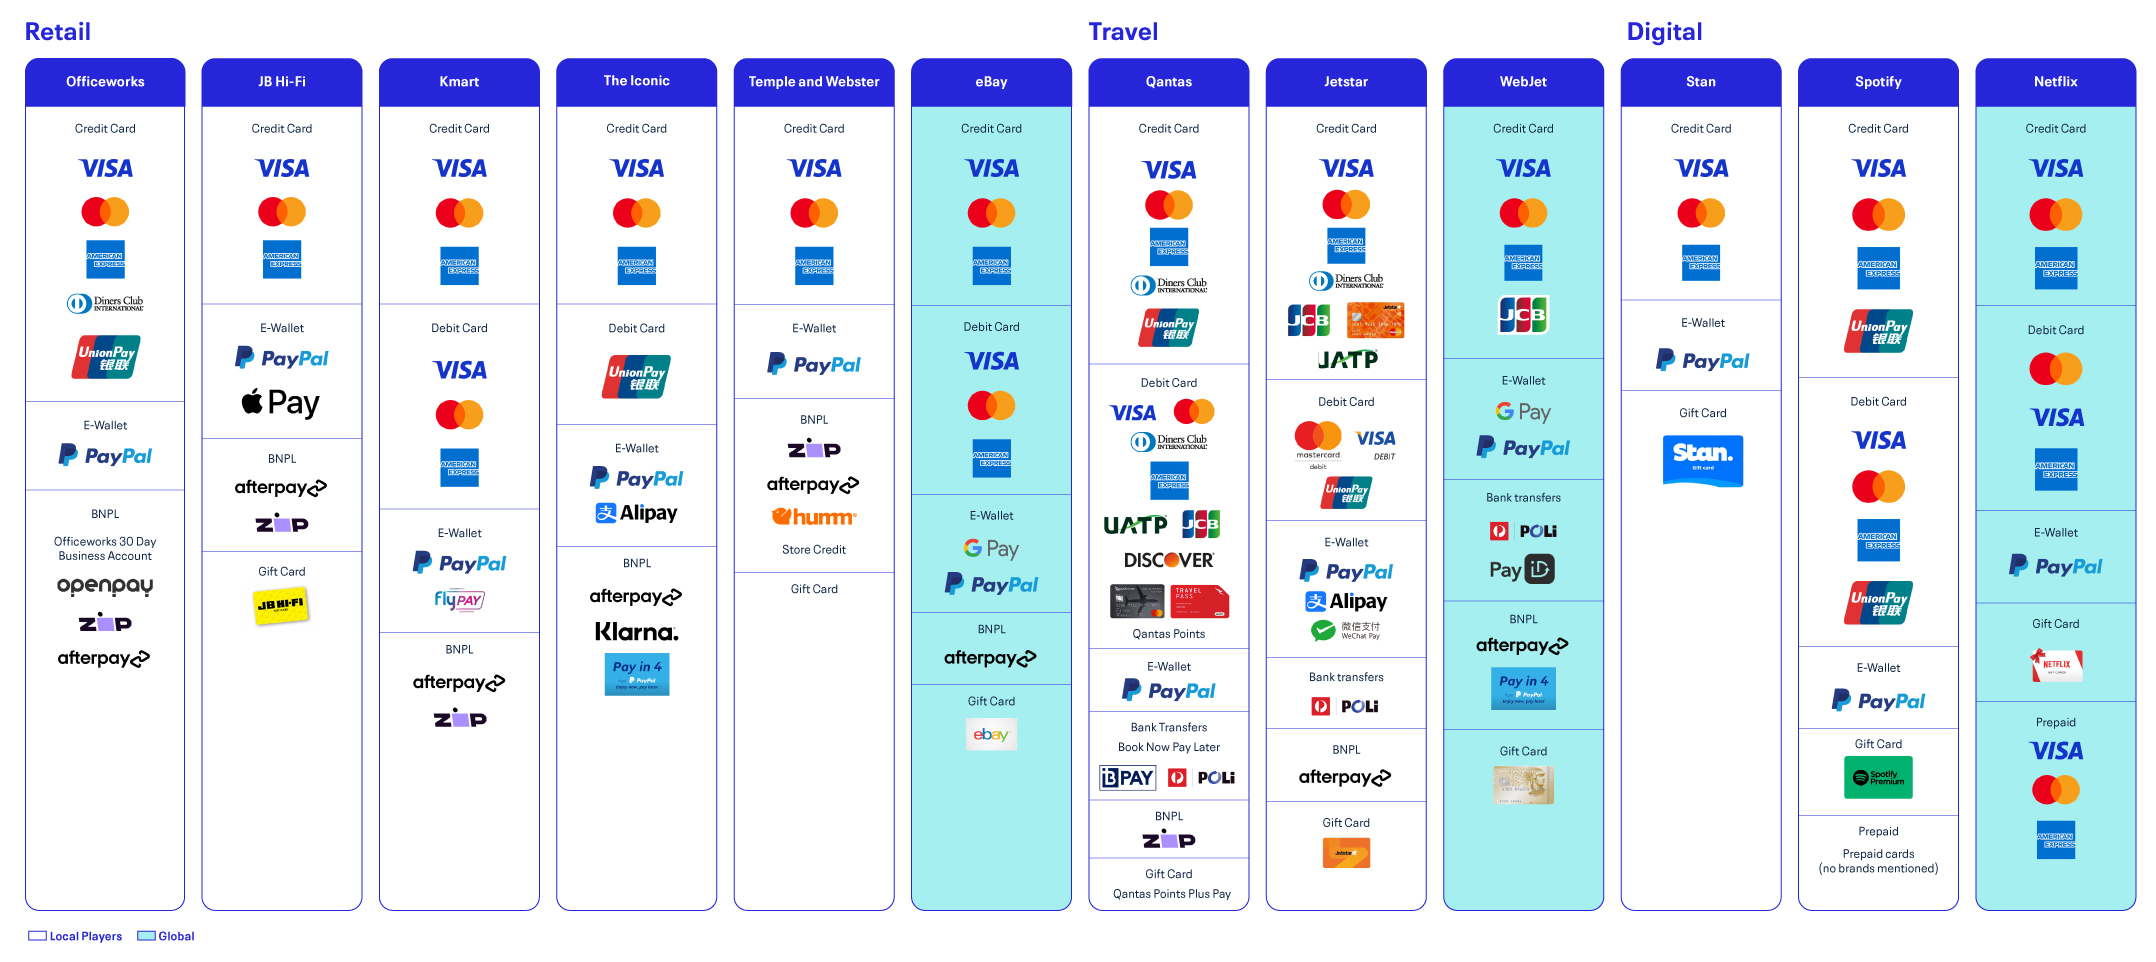
Payment Methods Offered at Checkout by Popular Merchants
12 / 23
![]()
![]()
![]()
The Local Payments Space
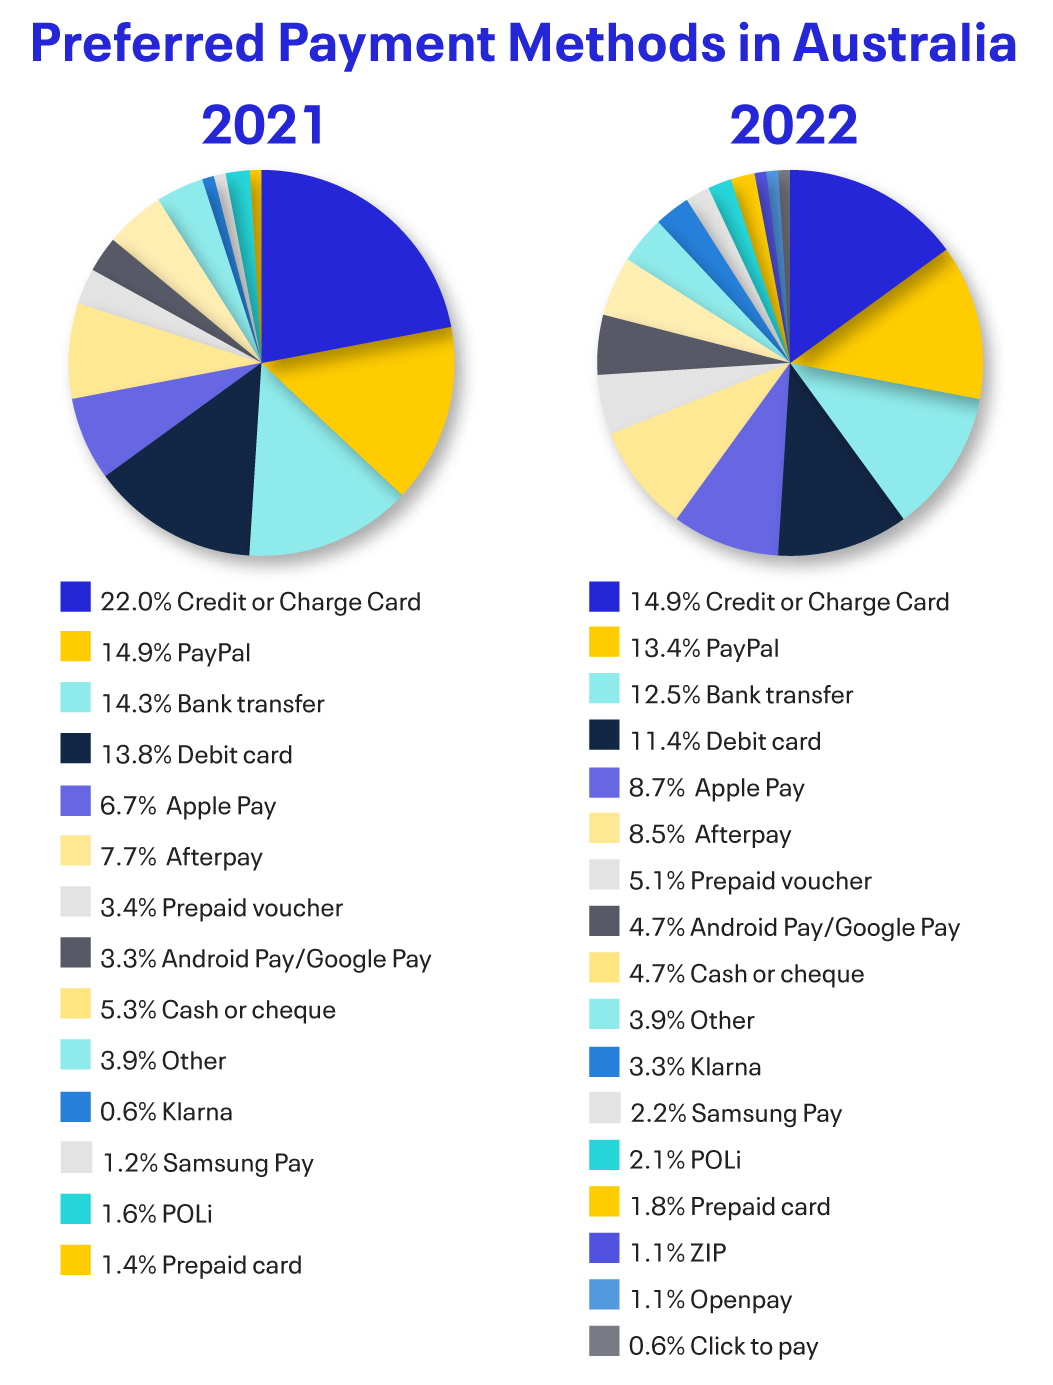
The range of payment methods available to Australians has expanded in recent years, currently including credit cards, debit cards, BNPL, eWallets, and account-to-account payments, in addition to cash and checks. One of the payment methods that became increasingly popular among consumers is represented by digital wallets: from March 2020 to March 2021, the number of monthly digital wallet transactions increased from 36 million to 68 million, and the total value of digital wallet transactions grew from AUD 1 billion to AUD 2.1 billion.
The demand for convenience and simplicity in eCommerce grew stronger across all demographics, highlighting the importance of payments modernization in order to seamlessly serve online shoppers. As a result, another payment method that gained more ground among Australians, particularly millennials, is BNPL – with Afterpay, Zip, and Klarna being some of the prominent providers of this payment method, according to a survey carried out by GlobalData in 2022.
13 / 23
![]()
![]()
![]()
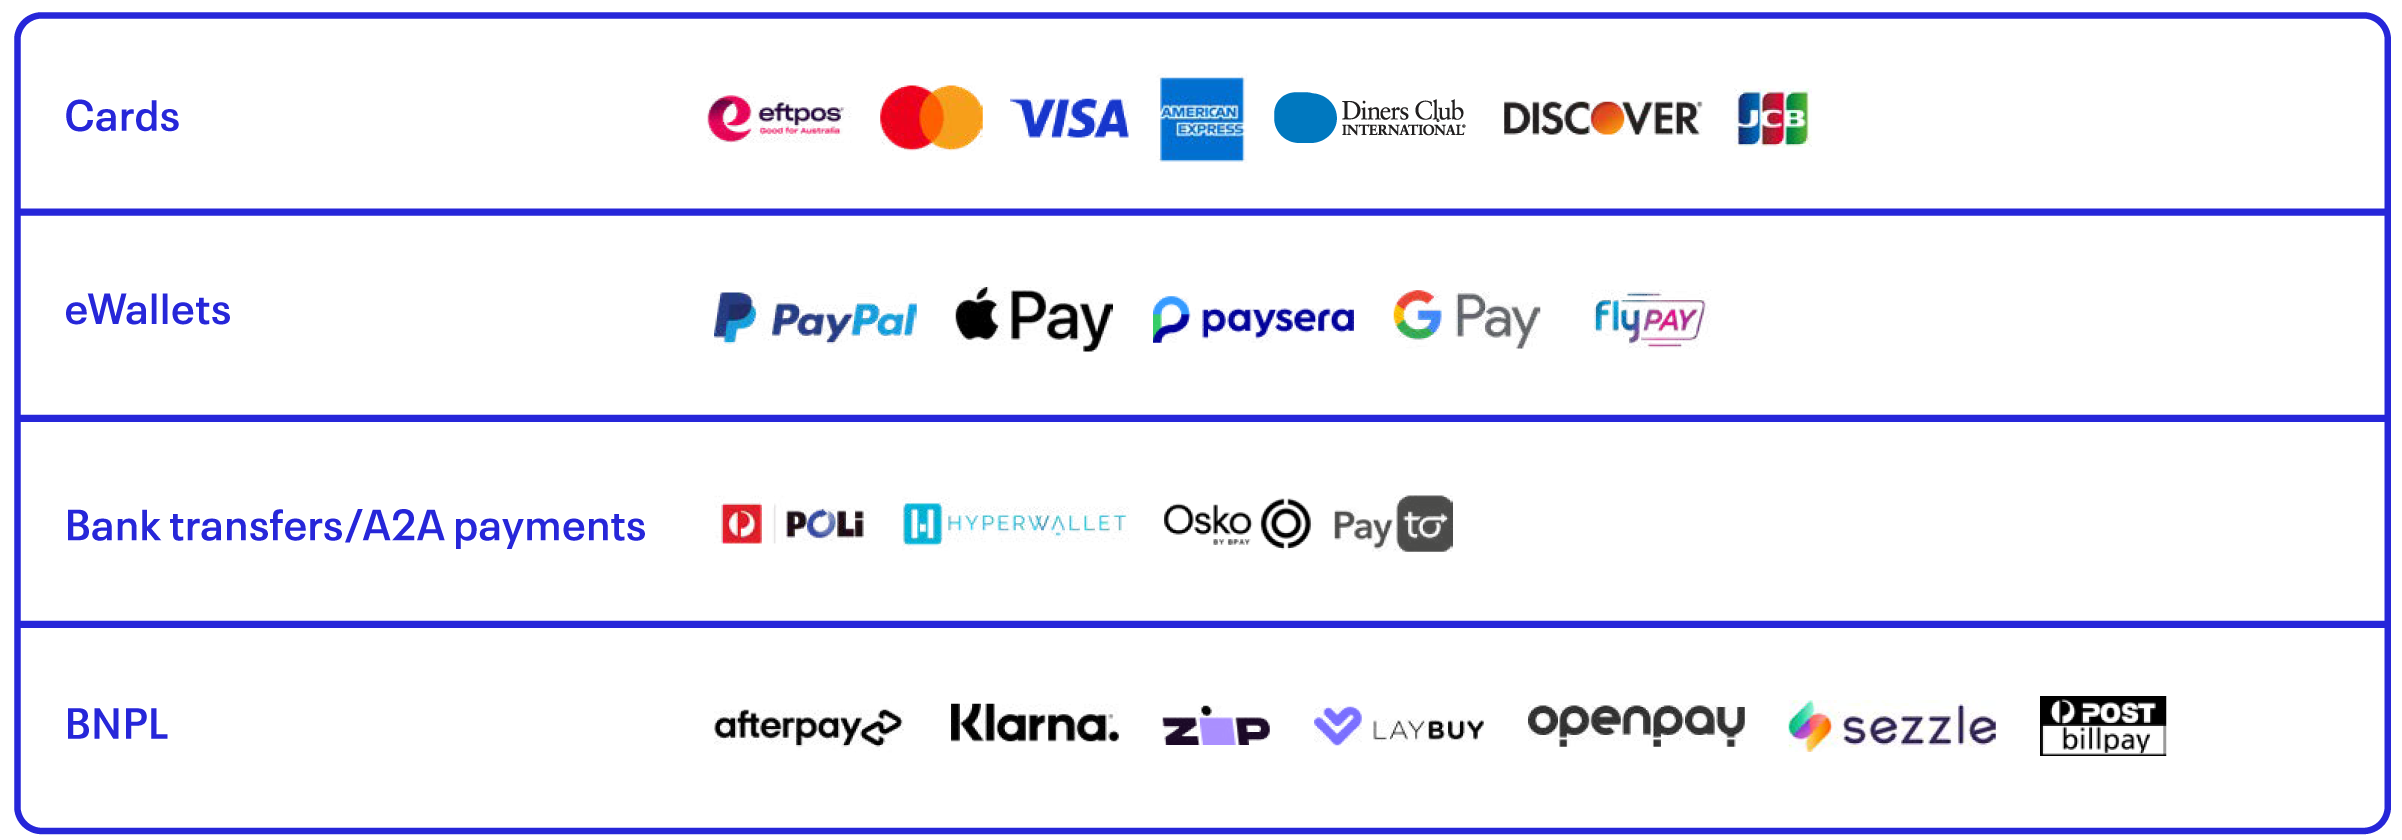
Relevant Payment Methods in Australia
14 / 23
![]()
![]()
![]()
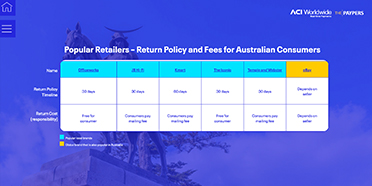
Popular Retailers – Return Policy and Fees for Australian Consumers
Name
Return Policy
Timeline
Return Cost (responsibility)
| Officeworks | JB Hi-Fi | Kmart | The Iconic | Temple and Webster | eBay |
|---|---|---|---|---|---|
| 30 days | 30 days | 60 days | 30 days | 30 days | Depends on seller |
| Free for consumer |
Consumers pay mailing fee |
Consumers pay mailing fee |
Free for consumer |
Consumers pay mailing fee |
Depends on seller |
Popular local brands
Global brand that is also popular in Australia
15 / 23
![]()
![]()
![]()
Logistics, Refunds and Return Policies
Delivery Preferences and Channels
Several major delivery companies operate in Australia, among which Australia Post, the national postal service, TNT Australia, DHL Australia, and StarTrack Courier, to name just a few. According to a report published by Australia Post, with Australian shoppers spending more time at home in recent years, there was a significant increase in home deliveries, but other delivery options also experienced a big shift, such as alternative collection points and parcel lockers.
A survey carried out by Australia Post found that the top three areas in which shoppers think retailers could make improvements are product availability, more delivery options, and eco-friendly packaging. Therefore, besides the speed of delivery, sustainable packaging and delivery options are among the key considerations when shopping online.
Refunds and Return Policies
According to the Australian Competition & Consumer Commission, if there is an issue with a product, consumers have the right to return it, even if it is not in its original packaging, but businesses are entitled to require proof of purchase.
Consumers are responsible for returning small products that can be easily shipped, whereas businesses are responsible for covering the cost of shipping for large items like televisions, installed appliances, or heavy furniture items. Additionally, in terms of return costs, when businesses confirm a certain product has a problem, they must reimburse consumers for the return costs already paid (and displayed on the shipping receipt). Following the inspection, if the business concludes that the product does not have a problem, it may require the consumer to pay for collection and inspection costs.
16 / 23
![]()
![]()
![]()
eCommerce at the Cutting Edge: Social Commerce, vCommerce, Crypto and CBDCs
The Social Commerce Opportunity
In January 2022, there were approximately 21.45 million social media users in Australia, which is equivalent to 82.7% of the total population. A study carried out in Australia and New Zealand found that shoppers considered social media to be the second most effective channel for marketing after email – and a report by Savvy found that 30.3% of Australians have purchased goods online via social media.
A survey focusing on small and midsized businesses (SMBs) in Australia found that they spend about $7,600 on their social media each year, which on average is approximately 12% of their marketing budget for businesses with marketing budgets. SMBs in Australia expect their investment in social media to generate a 12% increase in sales.
However, small businesses are less likely to have a social media strategy than medium businesses. Businesses in regional areas were also found to be less likely to have a strategy in place compared to businesses in metropolitan areas.
The social media platforms that SMBs most use for advertising, in order of popularity, are Facebook (83%), Instagram (22%), LinkedIn (16%), and Twitter (12%). Around 80% of Australian SMBs regarded social media advertising to be effective regardless of channel. Reportedly, 37% of SMBs tend to offer current and potential customers purchase incentives such as discounts (67%) and giveaways (45%), which likely enhances their sales on these channels. These incentives are most popular in industries such as wholesale (56%), hospitality (55%), and retail (54%).
17 / 23
![]()
![]()
![]()
The Future of VR and the Metaverse
Ipsos did a study on people’s knowledge and attitudes about virtual reality (VR), augmented reality (AR), and the metaverse in 29 countries including Australia. In Australia, they discovered the degree of familiarity for these was 80% for VR, 51% for AR, and 44% for the metaverse. When asked how they felt about engaging with extended reality, only 36% responded that they felt somewhat positively or very positively about it.
GetApp survey results showed that 12% of Australian consumers over the age of 18 have used virtual reality (VR) technology to shop. Among the remaining 88% of respondents who had never used VR to shop, 47% would like to try it. The survey also found that of those who used VR for shopping, 76% of them had also tried augmented reality (AR) to shop.
The most popularly purchased
products in VR wereFood and drink - 67%
Clothes and accessories - 67%
Virtual
real estate visits - 48%
Furniture and decorations - 36%
18 / 23
![]()
![]()
![]()
The top reason respondents chose VR shopping were to have a similar experience as in a store without leaving their home (59%), to avoid infection during the pandemic (59%), and to have more information about the product, which would help them make a better purchasing decision (51%). Australians who had shopped in VR were more willing to pay higher prices for VR equipment than consumers who had not used VR to shop. Only 17% of non-VR shoppers would spend over 300 Australian dollars for a VR headset, compared to 46% of VR shoppers.
Despite statistics indicating that only 44% of Australia was aware of the metaverse, Two Bulls and Thailand’s Translucia Global Innovation are developing a Metaverse R&D Center in Australia. Valued at around $100 million, it will be considered one of the largest operational centers in the world.
Furthermore, in January 2023, Tennis Australia partnered with Decentraland to co-host the Australian Open (AO) in the metaverse. The event was set based on specific areas of Melbourne Park where the tournament was held. The metaverse AO event featured virtual games and commerce of digital wearables for avatars and NFTs.
19 / 23
![]()
![]()
![]()
The Complexities of Crypto
According to research by Roy Morgan, Australian investments show that over 1 million Australians over the age of 18 own at least one cryptocurrency. Among them, the Cointelegraph found that the cryptocurrency most Australians hold is Bitcoin (9%), followed by Ethereum (8%), Dogecoin (5%), and Bitcoin Cash (4%).
Australians can use cryptocurrencies to purchase goods and services via services such as Crypto Spend. They offer an app and card that allow you to use your crypto to pay bills in fiat currency, without requiring you to convert it first. The currencies they support include Bitcoin, Ethereum, XRP, USDC, USDT, Bitcoin Cash, and Litecoin. Additionally, stores such as Zumi offer the option for consumers to pay using BitPay, a crypto wallet.
The ease with which you can use crypto to make purchases in Australia is increasing, as companies such as Peregrine Corp. partner with entities such as crypto.com to facilitate the use of cryptocurrencies in their fuel stations and convenience stores.
Trading in cryptocurrencies is legal in Australia but it is not regulated – meaning it is not considered legal tender. Under Australian law, crypto is seen more like property than a financial asset. This means that it is still subject to taxes, such as capital gains tax for consumers – and for businesses, their crypto is treated as trading stock.
The Australian government has also included cryptocurrencies in its national anti-money laundering framework, by requiring crypto exchanges to be registered with the Australian Transaction Reports and Analysis Centre (AUSTRAC). Additional efforts to inform and protect consumers when it comes to cryptocurrencies are visible, such as by the Australian Securities and Investment Committee (ASIC), which has a webpage set up to inform the public about them and to warn against the risks involved in crypto trading.
20 / 23
![]()
![]()
![]()
Unpicking the Fraud Factor and Regulatory Environment
Australia continues to see strong growth in eCommerce, with online retail growing 13.6% across 2022. While the success story of online card growth outpaces fraud by 8.0% to 5.7%, Card not Present (CNP) transactions continue to account for 91% of all Australian card fraud. Merchants in Australia and international retailers looking to expand “down under” need to have the correct controls in place to ensure bottom lines are protected – and growth is successful and sustainable.
Whilst online growth has been strong across most channels, this growth does not come without risk. AusPayNet’s fraud mitigation framework has championed fraud prevention over the past four years – bringing Strong Consumer Authentication (SCA) and Risk Based Analytics (RBA) into view for many merchants who wish to avoid fraud basis points of 20 or more. These terms have obligated many Australian businesses to look at online fraud with a degree of seriousness for the first time.
Australia continues to
see strong growth in
eCommerce, with online
retail growing
13.6%
across 2022.
21 / 23
![]()
![]()
![]()
However, the increasing value of card fraud losses to $495 million in 2021 highlights that Australian businesses continue to bear the brunt of illicit behavior. Merchants need to look at implementing both SCA and RBA tools to not only protect against these losses but also use their respective strengths in conjunction with each other to maximize approval rates.
2023 and 2024 could see strong growth in first- and third-party fraud in Australia as consumers battle with the highest growth in interest rates in decades. Fraud has traditionally been cyclical beside economic downturns and hardships, with criminals taking advantage of the situation, using social engineering to gather personal identifiable information and payment data to steal online goods.
Strong customer profiling, consortium data and machine learning models will be crucial in deterring these behaviors over the coming years. Card testing will also continue to be a scourge in Australia as fraudsters make use of the recent national data breaches before on-selling on the dark web for traditional thirdparty fraud. The growth in online spending will continue with some optimism in Australia, but merchants should view this with caution, as fraudsters will also seize this growth as an opportunity to “hide among the masses”.
*AusPayNet Annual Review 2022
22 / 23
![]()
![]()
Want to learn more about capitalizing on the growth of eCommerce in Australia?
Talk to ACI’s eCommerce consultants today, to discover winning payments and fraud management strategies for the new normal of eCommerce.
23 / 23
![]()